For a sequence of numbers like 2,5,10,17,… use WolframAlpha. Simply input your sequence as “curve fitting [sequence]” (e.g. “curve fitting 2,5,10,17”) and get the result. Here is an example.
For a set of pairs {x, y}, the approach is the same. Simply input your values into curve fitting (e.g. “curve fitting {{1,2},{4,17},{9,82},{16,257}}”) and get the result. Here is an example.
For a set of {x, y, z} building the formula is a bit trickier. First, you can try the magic of mathworks.com. Open the link, click on “Try This Example”, then put your dataset into the first grey box similar to this:
x = [1; 5; 10; 15; 20; 100]
y = [10; 20; 30; 0; 5; -100]
z = [12; 46; 131; 226; 406; 9901]
sf = fit([x, y],z,'poly22')
plot(sf,[x,y],z)
and… press “Run”. if you have more sample points, switch to a different fitting function, it can be poly11 to poly66. The first number is a max power of x, the second is a max power of y. You can rotate the graph to see how your points fit.
And… if you read up to this point, congrats, you are hardcore, and you probably have a much more difficult task to solve.
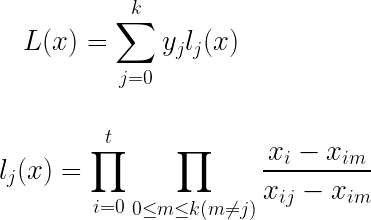
For finding a formula for a set of {x1, x2,…,xt, y} you can use an approach based on the Lagrange polynomial. This is extremely simple to understand but, once understood, is fairly simple to use. However, you need to carefully follow the rule, and it’s not practical for large sets of data. Let’s extend it beyond the original polynomial idea and apply it to a set of{x1, x2,…,xt, y} that contains k elements:

You can also use WolframAlpha to simplify the resulting formula. What to know more? Leave a comment, and I’ll write a post with a sample.
Happy interpolating!

